How to describe the particle size distribution?
2023-07-12WIKI

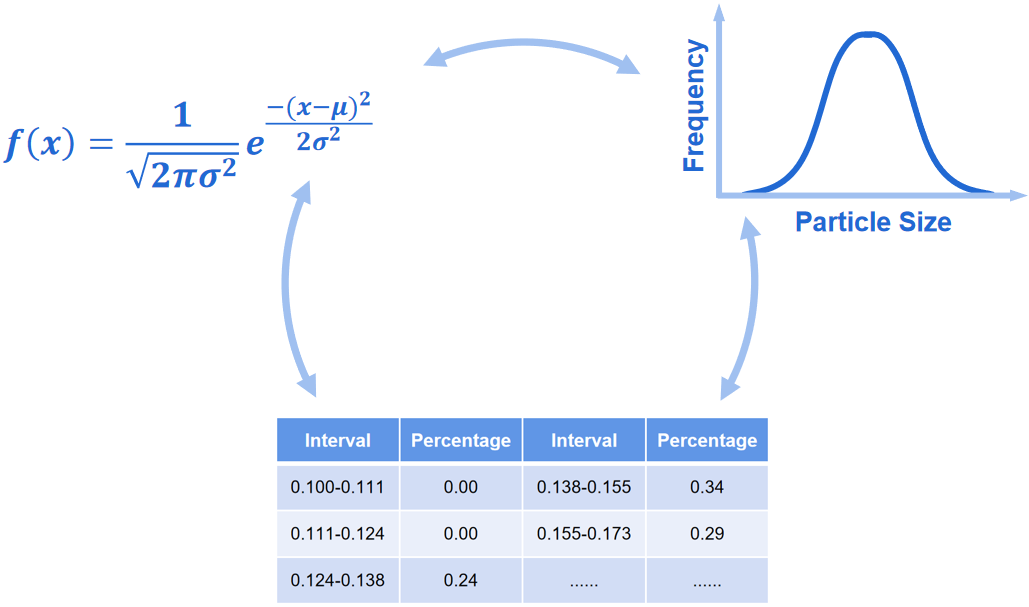
Typically, particle size distribution can be displayed using the following three methods:
Function:
Particle size distribution is presented in the form of mathematical functions, such as normal distribution function, log-normal distribution function, and R-R distribution function.
Graph:
Cumulative distribution curve, frequency distribution curve, and histogram are commonly used to describe how the particle size of the sample distributes.
Table:
Percentages and their corresponding particle size intervals are listed in the table, providing quick and intuitive access to the particle size distribution. Cumulative distribution table and frequency distribution table are included. Table is the most commonly used form to show the particle size distribution.


